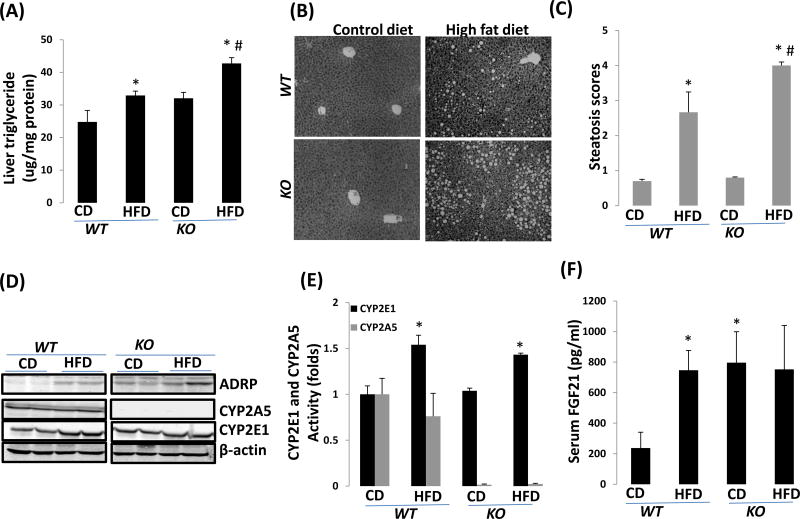
Figure 2.
HFD-induced nonalcoholic fatty liver is more severe in cyp2a5−/− mice than in cyp2a5+/+ mice. (A) Liver triglyceride. *P<0.05, compared with CD group; #P<0.05, compared with WT HFD group. (B) Liver section H&E staining. (C) Pathological quantification: steatosis score. *P<0.05, compared with CD group; #P<0.05, compared with WT HFD group. (D) Liver expression of CYP2E1, CYP2A5, ADRP, PPARα and FGF21. (E) Activities of microsomal CYP2E1 and CYP2A5. *P<0.05, compared with CD group. (F) Serum FGF21 level. *P<0.05, compared with WT CD group.

