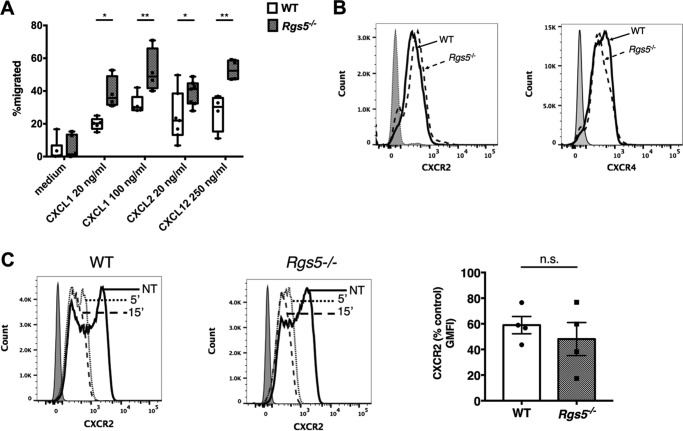
Figure 5.
Increased chemotaxis of RGS5-deficent neutrophils. A, chemotaxis of BM-derived neutrophils was assessed in Transwell assays as described under “Experimental procedures.” Error bars indicate mean ± S.E. of four to six experiments using cells from one to two mice of each genotype/experiment. *, p < 0.02; **, p < 0.006, two-way ANOVA, Sidak multiple comparisons. B, surface CXCR2 or CXCR4 in untreated BM-derived neutrophils was assessed by flow cytometry. Histograms represent a single mouse/genotype representative of two to three mice evaluated in separate experiments; the shaded peak represents cells stained with isotype control antibody. C, surface CXCR2 expression in BM-derived neutrophils pre- and poststimulation with CXCL2 (100 ng/ml) for the indicated times. The bar graph is CXCR2 geometric mean fluorescence intensity (GFMI) after treatment with CXCL2 for 15 min as a percentage of that measured in untreated cells (error bars indicate mean ± S.E. of four independent experiments using cells from one mouse of each genotype/experiment). n.s., not significant.

