Figure 4.
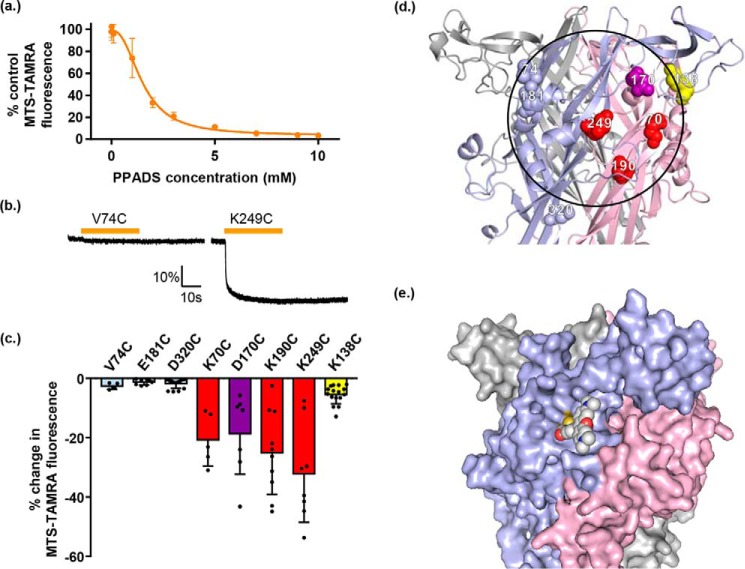
PPADS quenches MTS-TAMRA fluorescence and highlights cysteine mutants lining the antagonist-binding site. a, graph showing percentage of MTS-TAMRA fluorescence remaining after addition of different PPADS concentrations. The baseline fluorescence of 1 μm MTS-TAMRA was measured via Flexstation, then different concentrations of PPADS were added after 20 s and any change in fluorescence was monitored, data are shown as mean ± S.D. (n = 3). b, example traces of fluorometry recordings from oocytes expressing hP2X1R single cysteine point mutants labeled with MTS-TAMRA. Oocytes were perfused with ND96, then 10 μm PPADS was applied for 30 s by perfusion (bar above trace) and any changes in fluorescent output were measured. Changes in fluorescence were quantified as the percentage change in fluorescent output compared with baseline level measured before PPADS application. Scale bars apply to all traces. c, graph showing the average change in fluorescence for the mutants tested. A 5% decrease in fluorescence is shown as a dotted line, data are shown as mean ± S.D. (n ≥ 5). The effects of PPADS on cysteine accessibility and antagonist sensitivity were: V74C, E181C, and D320C (light blue) PPADS decreased in MTSEA-biotin and there was no change in PPADS sensitivity, at K70C, K190C, and K249C (red) MTSEA-biotin labeling was reduced following PPADS treatment and PPADS sensitivity was also reduced, at D170C (purple) PPADS decreased MTSEA-biotin access and sensitivity was increased, at K138C (yellow) PPADS increased MTSEA-biotin access and decreased PPADS sensitivity. d, hP2X1R homology model showing the positions of the introduced single cysteine residue mutations. Blue labeling indicates cysteine mutants with a PPADS induced decrease in MTSEA-biotinylation but no effect on PPADS sensitivity, red is for those with a decrease in MTSEA-biotinylation following PPADS treatment and a decrease in PPADS sensitivity, and yellow corresponds to residues where MTSEA-biotinylation was increased by PPADS and also showed a decrease in PPADS sensitivity. e, hP2X1R homology model surface representation with K249C linked MTS-TAMRA (modeled manually). Compared with d, the receptor is slightly rotated to the left for clearer visualization of MTS-TAMRA (shown as spheres).

