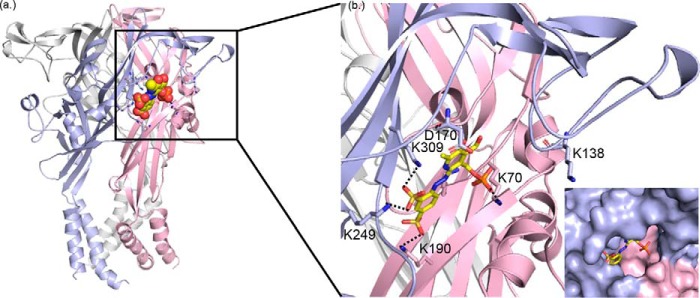
Figure 5.
PPADS docking pose in best agreement with experimental data. a, cartoon representation of open state hP2XR1 model with subunits shown in red, blue, and white, respectively. The docked PPADS pose from the largest, top ranked cluster that is best explaining data for Lys-70, Asp-170, Lys-190, and Lys-249 is shown as spheres. b, zoom into a, detailing key charge interactions between PPADS and hP2XR that are discussed in the text.

