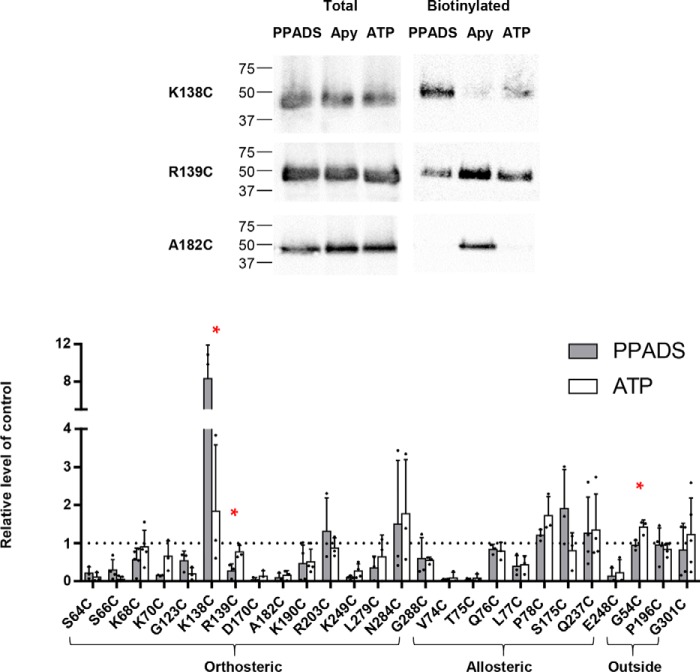
Figure 7.
Comparison of the effects of PPADS and ATP on MTSEA-biotinylation at cysteine mutants. Upper panel shows representative blots of the MTSEA-biotinylation levels of mutant P2X1Rs in the presence of PPADS, apyrase control, or ATP. The graph shows the effects of PPADS (gray shading) or ATP (open boxes) on the relative level of biotinylation compared with the control (in the presence of apyrase to break down any endogenous ATP). Data are shown as mean ± S.D. (n = 3), *, p < 0.05.

