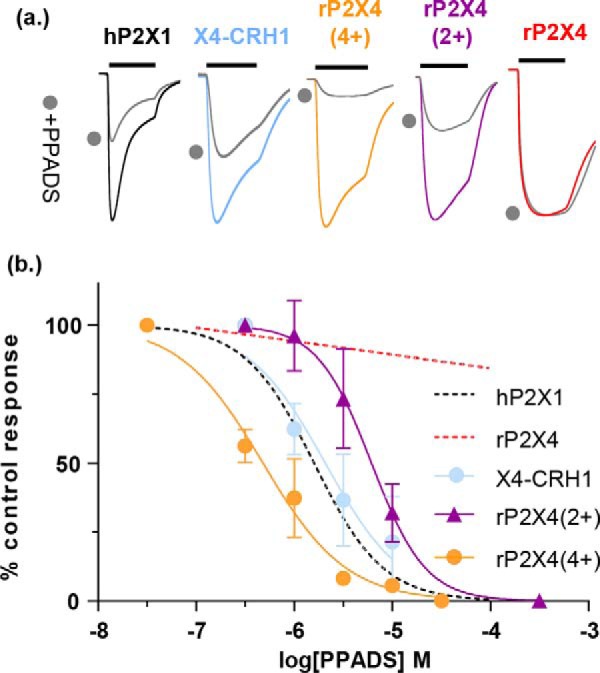
Figure 8.

Positive charge at the base of the cysteine-rich head region imparts PPADS sensitivity to the rP2X4R. a, representative traces showing application of ATP and ATP + 1 μm PPADS (filled circles) for rP2X4R, the X4-CRH1 chimera and hP2X1R for rP2X4(2+) and rP2X4(4+) mutant receptors. b, PPADS inhibition curves. All inhibition was measured at an EC90 concentration of ATP. Dotted lines correspond to previously published mean data from Farmer et al. (19). The black bar corresponds to the period of agonist application (3 s) and PPADS was pre-superfused over the oocyte and co-applied with ATP (filled circles). Traces have been normalized to peak current to allow for comparison. Data are plotted as mean ± S.D. n = 3–4.
