Figure 3.
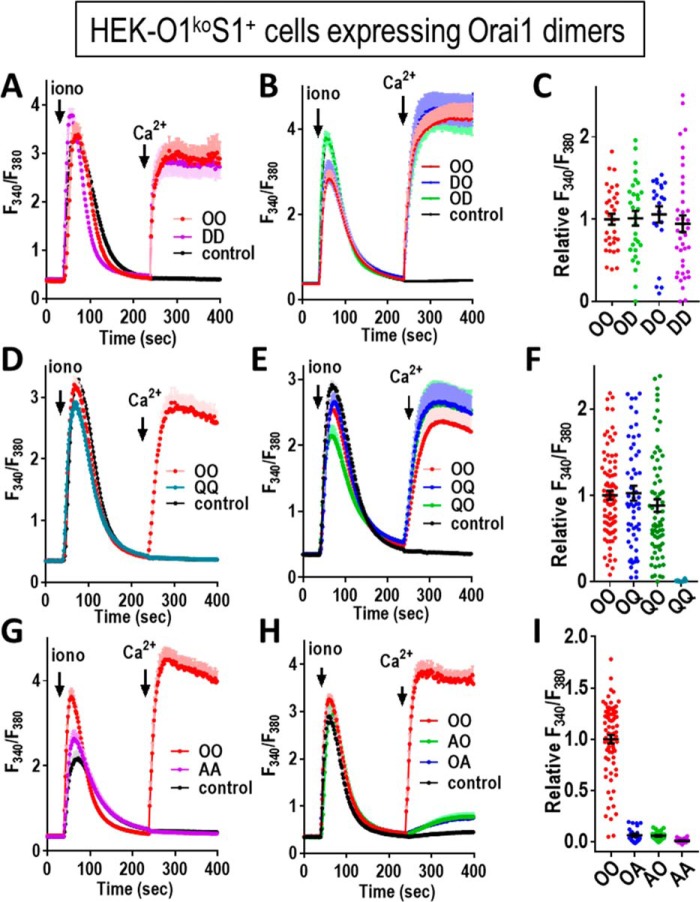
Function of concatenated Orai1 dimers containing the E106D and E106Q selectivity filter mutations. Orai1-tdT dimer constructs were transiently expressed at similar levels in HEK-O1koS1+ cells, and fura-2 ratiometric Ca2+ measurements were made to determine cytosolic Ca2+ after store depletion with 2.5 μm ionomycin (iono) in Ca2+-free medium, followed by addition of 1 mm Ca2+ (arrows). A, cells were transfected with either Orai1-WT homodimer (OO) or Orai1-E106D homodimer (DD) or untransfected (control). B, cells were transfected with either OO or Orai1-WT/Orai1-E106D (OD), Orai1-E106D/Orai1-WT (DO), heterodimers, or untransfected (control). C, summary scatter plots with means ± S.E. for peak Ca2+ entry of all individual cells recorded in three independent experiments with the Orai1 concatemer constructs shown in A and B. D, cells were transfected with either Orai1-WT homodimer (OO) or Orai1-E106Q mutant homodimer (QQ) or were untransfected (control). E, cells were transfected with either OO or with Orai1-WT/Orai1-E106Q (OQ) or Orai1-E106Q/Orai1-WT (QO) dimer or were untransfected (control). F, summary scatter plots with means ± S.E. for peak Ca2+ entry of all individual cells recorded in three independent experiments with the Orai1 concatemer constructs shown in D and E. G, cells were transfected with either Orai1-WT dimer (OO) or Orai1-E106A homodimer (AA) or were untransfected (control). H, cells were transfected with either OO or Orai1-WT/Orai1E106A (OA) or Orai1-E106A/WT dimer (AO) or were untransfected (control). I, summary scatter plots with means ± S.E. for peak Ca2+ entry of all individual cells recorded in three independent experiments with the Orai1 concatemer constructs shown in (G and H). All the traces shown (means ± S.E.) are representative of three independent experiments.

