Figure 9.

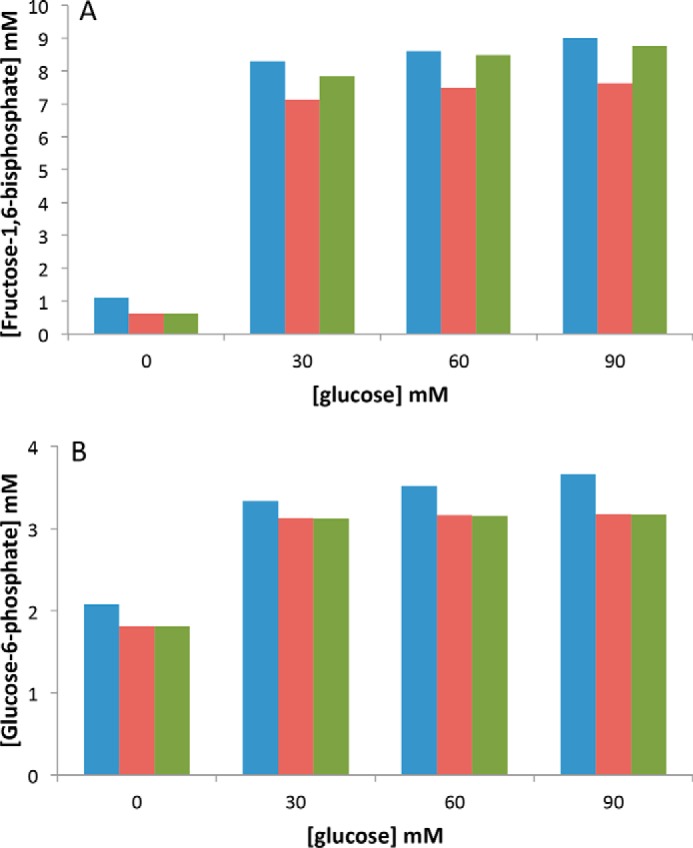
Experimental (blue, values are from the WT) and simulated (orange, without inhibition and green, with inhibition) values of F1,6bP (A) and G6P (B) at various glucose concentrations.

Experimental (blue, values are from the WT) and simulated (orange, without inhibition and green, with inhibition) values of F1,6bP (A) and G6P (B) at various glucose concentrations.