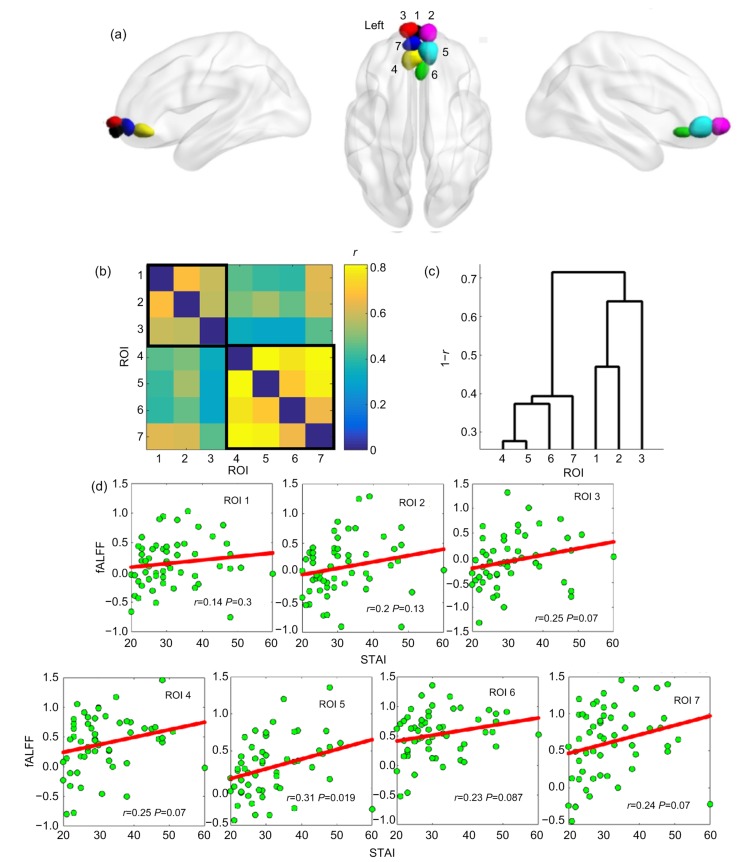
Fig. 2.
mOFC subregions and their relationships between fALFF and trait anxiety scores
(a) Automated detection of seven mOFC subregions. (b) Mean pairwise correlation (r) matrix of subregional BOLD time courses. (c) Hierarchical clustering based on the correlation matrix-revealed two zones. (d) Scatterplots for the relationship between fALFF and STAI values in seven mOFC subregions. ROI, region of interest; fALFF, fractional amplitude of low-frequency fluctuation; STAI, State-Trait Anxiety Inventory

