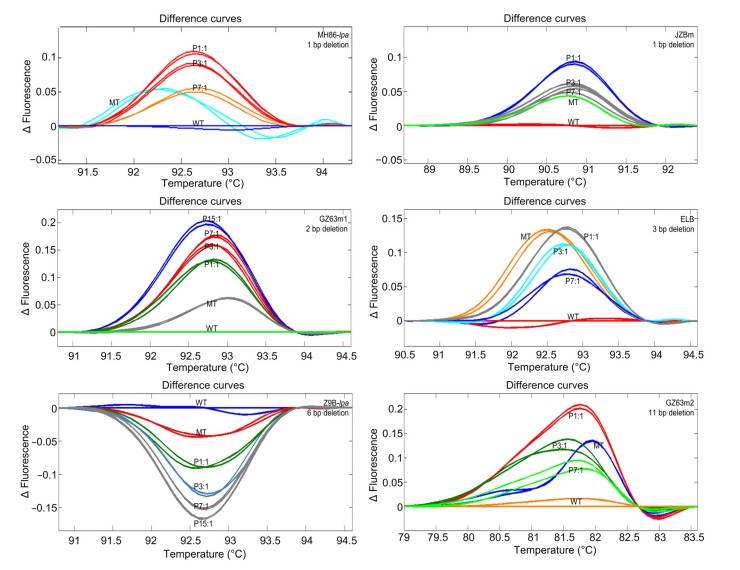
Fig. 2.
HRM analysis of pooled rice samples at different wild-type (WT):mutant (MT) DNA ratios
WT samples were used as references for each analysis and are shown as horizontal lines. Fluorescence difference curves are automatically grouped by the HRM system and are indicated by different colors. P1:1, 3:1, 7:1, and 15:1 stand for the mixture ratios of WT:MT

