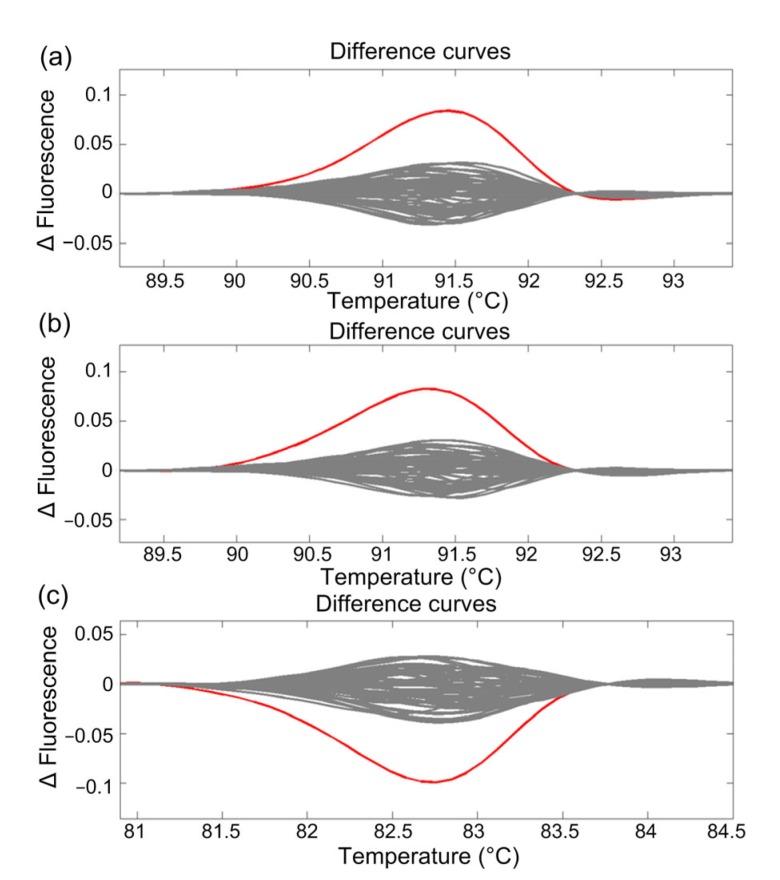
Fig. 3.
HRM analysis of pooled M2 rice seedlings for mutations in OsLCT1 (a, b) and SPDT (c) genes
The wild-type (WT, horizontal line) was chosen as the reference for the development of fluorescence difference curves. The mutants (red lines) were automatically sorted by the system because their HRM curves had ∆F values of >0.05 from the WT curves

