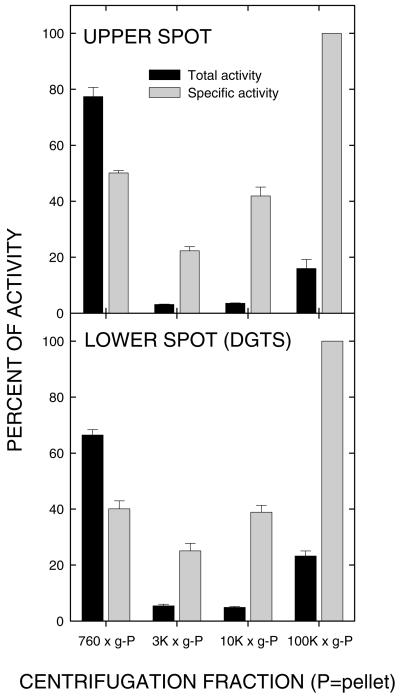
Figure 2.
Relative total and specific activities for synthesis of each of the products described in Figure 1 by the active fractions described in Table I. Note the parallel in relative rates of synthesis in each of the fractions, thus further supporting a precursor-product relationship between the upper and lower spots.

