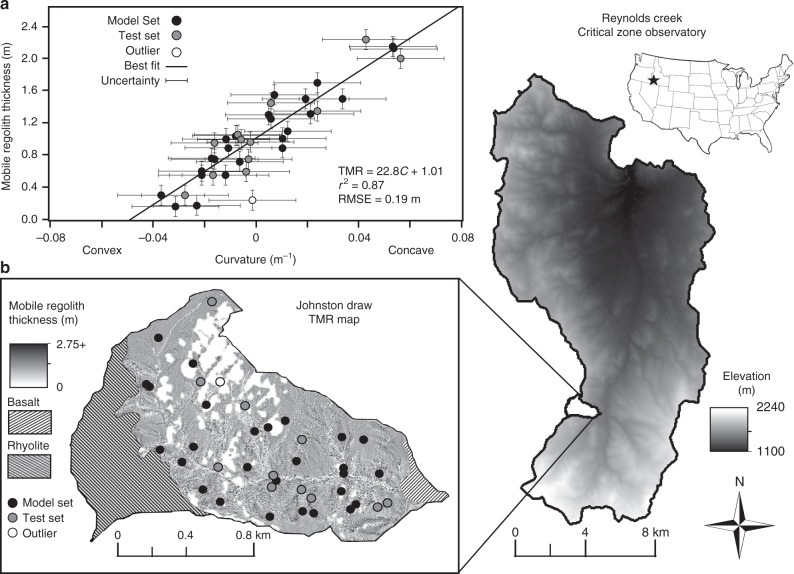
Fig. 1.
Curvature and thickness of the mobile regolith plot and predictive map. a The thickness of the mobile regolith (TMR) varies as a strong linear function of curvature (C) in Johnston Draw. Black dots represent randomly selected build dataset (70% of sites). Gray dots represent test set to validate the model. The white dot is a location that was excluded owing to proximity to both a rock outcrop and a stream channel. Uncertainty is reported as the standard error by the Method of Moments. b Predicted TMR map for the granitic portion of Johnston Draw derived from the TMR-curvature function using a 3 m Light Detection and Ranging (LiDAR)-derived digital elevation model. Darker shades indicate larger TMR (2.75 + m) and lighter shades indicate smaller TMR (0 m) including those areas excluded as rock outcrops or streams. Hatched areas indicate non-granitic portions of the watershed that were not modeled

