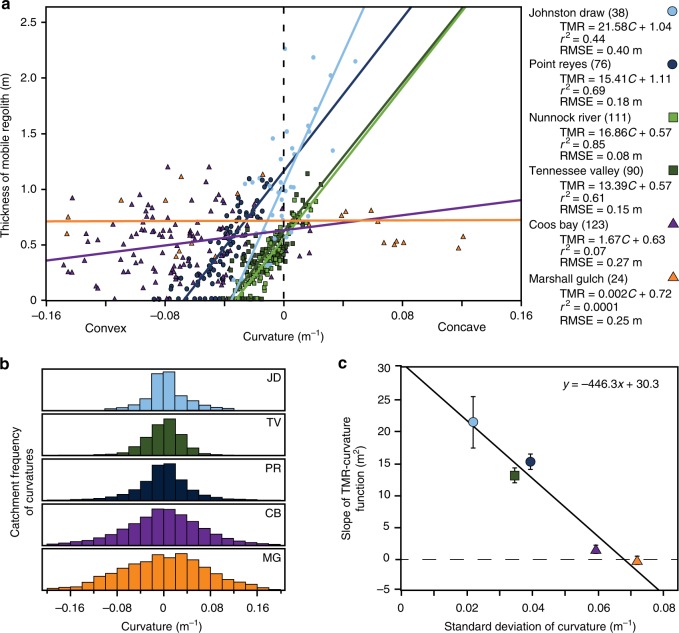
Fig. 2.
Cross-site evaluation. a Cross-site evaluation of six catchments in which the thickness of the mobile regolith (TMR)-curvature (C) function is evaluated using a 5-m digital elevation model (DEM). b Depicts catchment curvature distributions based on a 5 m DEM centered on 0 m−1. c Cross-site comparison of the slope of the TMR-curvature function (and associated standard error) with the local standard deviation in catchment curvature (σc). Nunnock River (light green squares) dataset was not included in plots b or c due to the lack of high resolution Light Detection and Ranging (LiDAR) data; curvature estimates for Nunnock River in a were derived from reported local observations20. Note, the curvature distributions are derived from all cells within the catchment’s DEM

