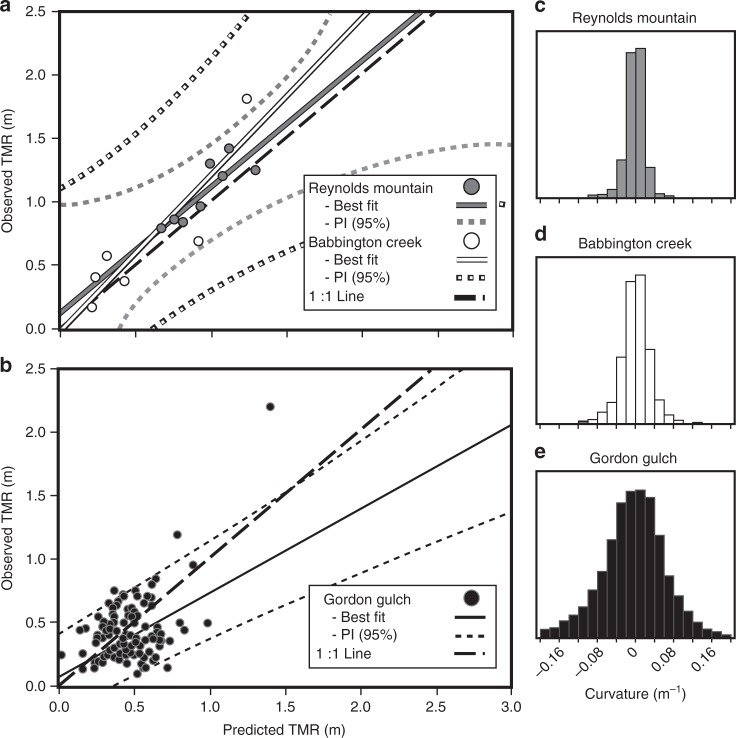
Fig. 3.
Model validation. Validation of the thickness of the mobile regolith (TMR)-curvature (C) approach at Babbington Creek and Reynolds Mountain, Idaho (a) and Gordon Gulch, Colorado, USA (b). Solid white, gray, and black lines represent best-fit predicted vs. observed TMR values based on curvature calculated from a Light Detection and Ranging (LiDAR)-derived digital elevation model (DEM) and a single soil pit for Reynolds Mountain (c), Babbington Creek (d), and Gordon Gulch (e), respectively. Large dashed black lines represents the 1:1 predicted versus observed line. The best-fit slopes were not significantly different from one for Babbington Creek (|t| = 0.74 < critical t0.05,5 = 2.571) and Reynolds Mountain (|t| = 0.01 < critical t0.05,7 = 2.365), indicating unbiased models, whereas the slope was significantly lower than one for Gordon (p < 0.001, |t| = 3.64 < critical t0.05,162 = 1.974), indicating over-prediction with higher TMR than observed. Small white, gray, and black dotted lines represent the 95% prediction intervals (PI)

