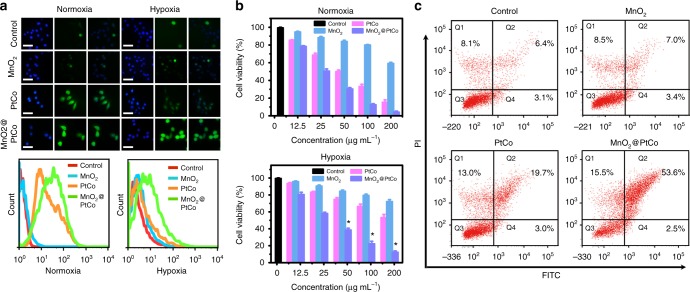
Fig. 4.
In vitro assessments of MnO2@PtCo nanoflowers-induced intracellular oxidative damage. a Detection of MnO2@PtCo nanoflowers-induced ROS in 4T1 cells in normoxic and hypoxic culture media by fluorescence microscopy and flow cytometry, respectively. The left, middle and right images show DAPI (blue), DCFH-DA (green) and the merged images, respectively. The left, middle and right images show DAPI (blue), DCFH-DA (green) and the merged images, respectively. Scale bars are 50 μm. b Cell viability of 4T1 cells treated with different concentrations of nanoparticles for 48 h in different O2 tensions. Asterisks indicate significant differences (*P < 0.01, **P < 0.005, ***P < 0.001), analyzed by unpaired Student’s two-sided t test. Data were presented as mean ± s.d. (n = 5). c Fluorescein-annexin V and PI staining assays of 4T1 cells treated with different formulations

