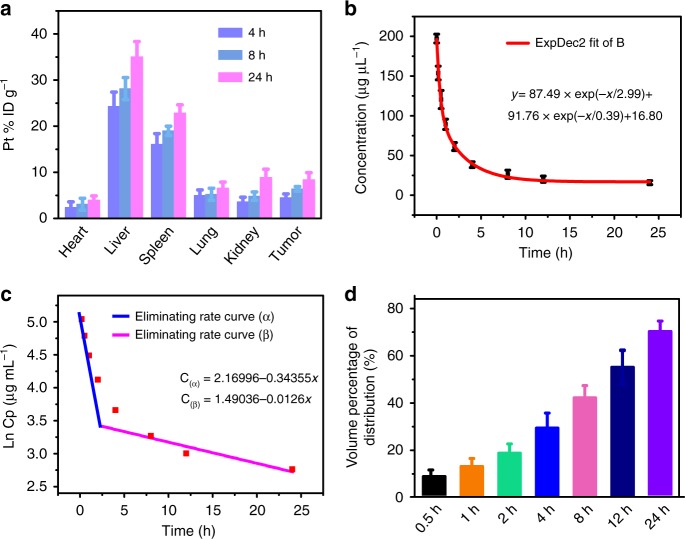
Fig. 7.
The pharmacokinetics studies of MnO2@PtCo nanoflowers. a The biodistribution of nanoflowers in main organs and tumors at different time points. b The blood circulation curve of intravenously injected nanoflowers. c The eliminating rate curve of nanoflowers from the blood circulation curve according to the In(concentration)–T relationship. d The apparent volume percentage of distribution (Vd%) of intravenously injected nanoflowers. Data were presented as mean ± s.d. (n = 3)

