Fig. 1.
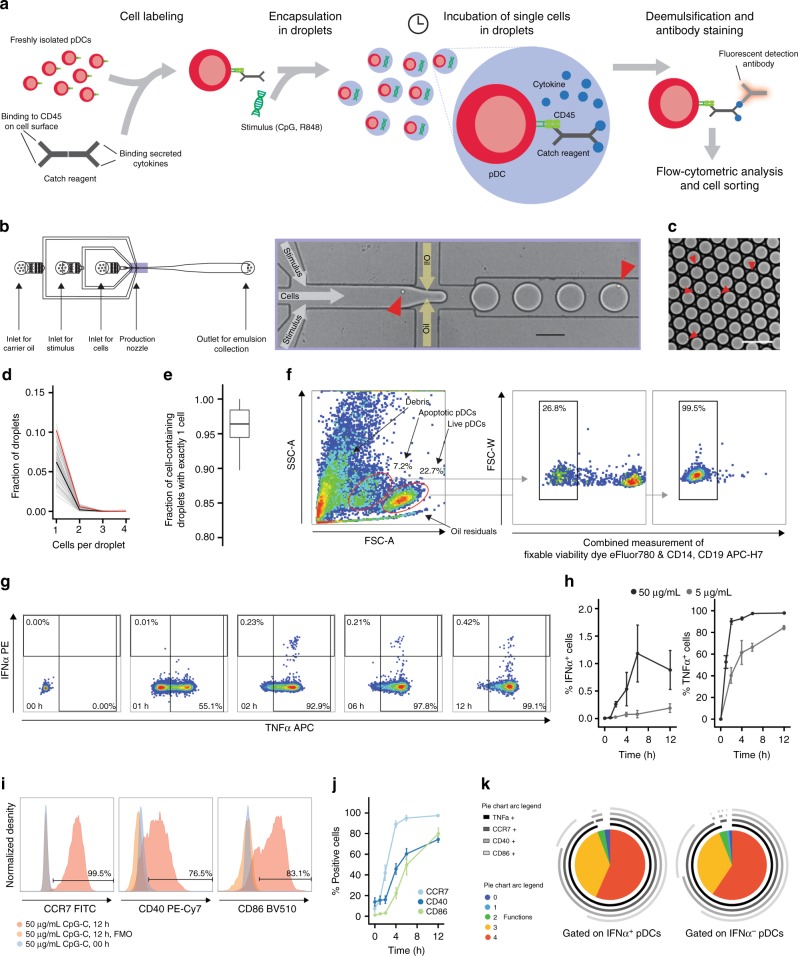
Single-cell analysis reveals functional heterogeneity within individually stimulated pDCs. a Schematic overview of the droplet microfluidic assay. The pDCs were coated with cytokine capture reagents, encapsulated in picoliter droplets, and stimulated with TLR ligands. After incubation, cells were stained for viability, cytokine, and surface marker expression, and analyzed by flow cytometry. b Schematic overview of the employed microfluidic chip with microscopic image of the flow-focusing nozzle for the encapsulation of cells in droplets. c Microscopic image of emulsion after droplet production. b, c Red arrows indicate cells. Scale bars equal 100 µm. d The pDCs were encapsulated at a concentration of 1,300,000 cells/mL in 92 pL droplets. The distribution of cells in droplets was measured by manual analysis of microscopic images showing the emulsion directly after production. Shown is the fraction of droplets plotted against the number of cells per droplet; n = 85, black line indicates median, red line indicates predicted values. e Shown is the fraction of cell-containing droplets with exactly one cell; n = 85. Lines indicate mean, hinges mark interquartile ranges, and whiskers reach to the highest/lowest value that is within 1.5 × interquartile range. f–k The pDCs were treated as described above and stimulated with 5 μg/mL or 50 µg/mL CpG-C. f Viable pDCs were detected by forward scatter (FSC) and side scatter (SSC) analysis and subsequent gating on CD14−CD19− and viability dye− cells. g IFNα- and TNFα-secreting cells were detected within that population. h Shown is the fraction of cytokine-secreting cells plotted against incubation time; n (5 µg/mL) = 3, n (50 µg/mL) = 6. i Surface marker-expressing pDCs were identified comparing the expression levels to fluorescence-minus-one controls. j Shown is the fraction of surface marker-expressing cells plotted against the incubation time; n > = 4. k The co-expression of CCR7, CD40, CD86, and TNFα by single IFNα+ and IFNα− pDCs was analyzed. Shown is the relative contribution of each functional response pattern to the total pDC population. h, j Dots indicate mean, error bars indicate SEM

