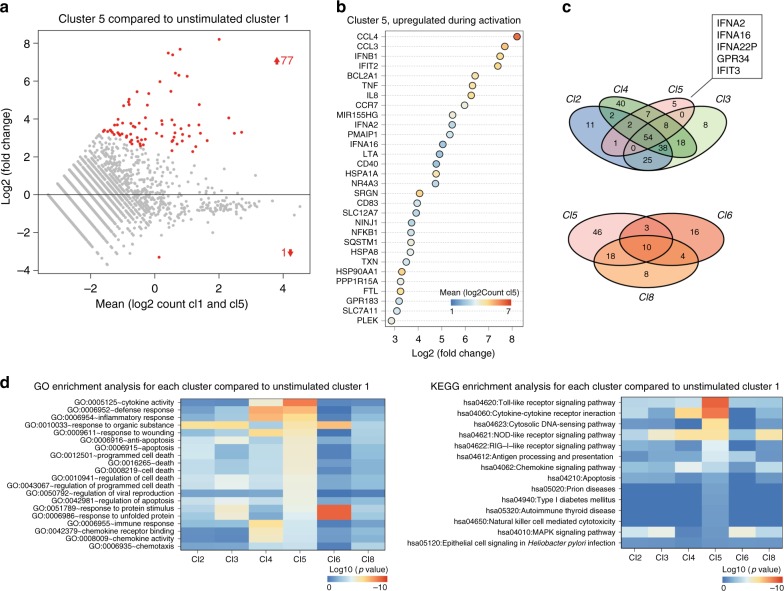
Fig. 4.
Type I IFN-expressing pDCs show unique gene expression patterns. a Differentially regulated genes in cells from all activated clusters compared to cluster 1 were identified. Differentially regulated genes from cluster 5. The average log2(count) of each gene is plotted against the log2(fold change) compared to cells in Cl1. Red color indicates p value < 10−8. b The top 30 most upregulated genes are shown for cluster 5. Shown is the log2 fold change for each gene. The color scale indicates the average log2(Count) for each transcript in Cl5. c Venn diagram of the upregulated genes (log2(fold change) > 1.5, p value < 10−8) within different clusters. d Lists of upregulated genes were submitted to DAVID for GO enrichment analysis and KEGG enrichment analysis. Heat maps show the most significantly enriched terms for the gene list from cluster 5. The color scale indicates the significance of enrichment of a particular term in all selected clusters after Benjamini–Hochberg correction for multiple testing

