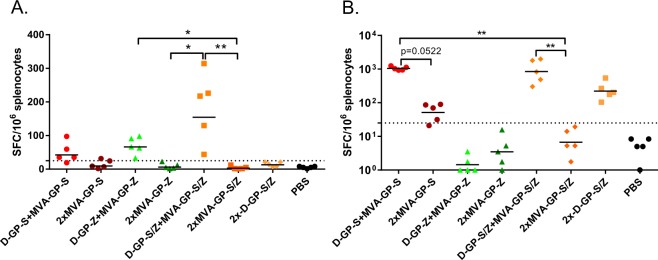
Figure 7.
Analysis of GP-specific T cell responses. T cell responses were analyzed by ELISpot after restimulation of splenocytes with the CD8 + restricted peptides LYDRLASTV (A) present in both SUDV and EBOV GP or RPHTPQFLF (B) from the SUDV GP protein. Mice were primed and boosted with 5 µg of D-GP-S/Z (2.5 μg of each) constructs or 1 × 10⁷ pfu of MVA-GP-S/Z vaccine candidates as indicated. Animals were immunized on days 1 (prime) and 28 (boost) and spleens were collected 21 days after boost. The dotted line represents the cutoff for a positive response (25 SFC per million splenocytes). Statistical analysis was performed comparing all groups except PBS immunized controls using Kruskal Wallis test followed by Dunn’s test for multiple comparisons, *P < 0.05; **P < 0.01. Comparisons that were non-significant are not indicated. Animals immunized with the EBOV virus GP were excluded from the statistical multiple comparison analysis for the results with the SUDV derived peptide in panel B, since they did not encode the epitope used for restimulation.

