Figure 5.
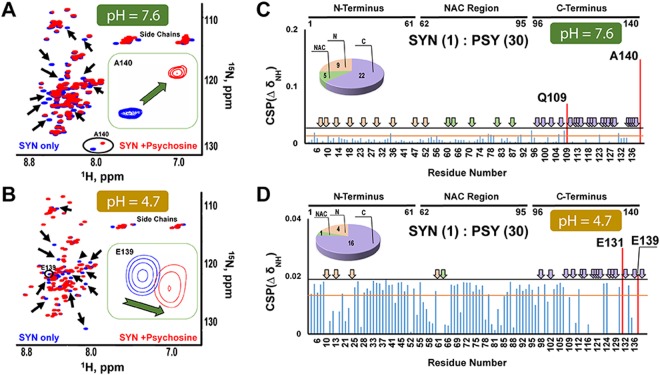
Psychosine interacts with α-synuclein at cytoplasmic (neutral) and lysosomal (acidic) pH. Overlays of 1H 15N-HSQC NMR spectra of α-synuclein (blue) with α-synuclein (1) psychosine (30) (red) at pH 7.6 (A) and α-synuclein (1) psychosine (30) (red) at pH 4.7 (B). Examples of chemical shift changes are circled and highlighted in a box. Black arrows indicate areas of signal broadening. The CSPs were measured from the spectra α-synuclein (1) psychosine (30) (red) at pH 7.6 (C), and α-synuclein (1) psychosine (30) (red) at pH 4.7 (D). The black horizontal line represents the mean CSP plus one SD. The orange horizontal line represents the maximum CSP due to spectral variability between different samples of α-synuclein. CSPs higher than both the black and orange lines were considered significant and are marked in red. The broadened- beyond-detection signals were assigned by arrows marked in pink in the N-terminus, green in the NAC region, and purple in the C-terminus. The number of signals that were broadened are presented in a pie chart. PSY = psychosine; SYN = α-synuclein.

