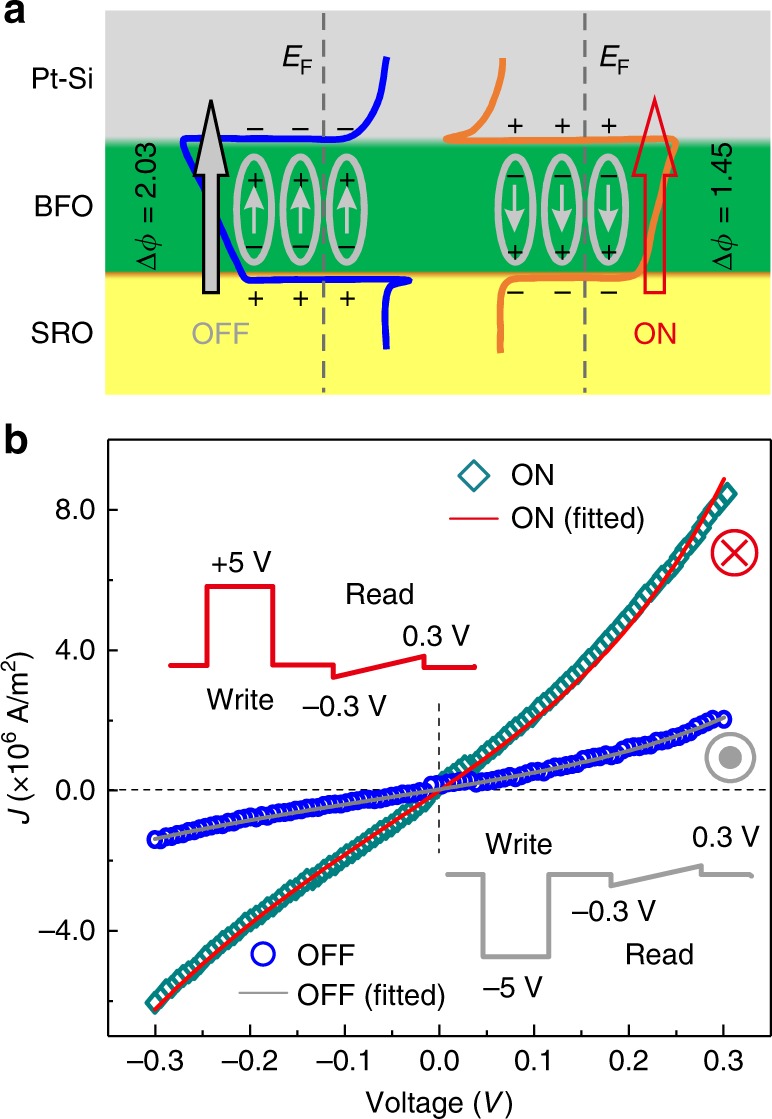
Fig. 4.

Ferroelectric tunneling junction and tunneling mechanism in 1-u.c. BFO. a Schematic of electrostatic potential (ϕ) profiles in the OFF and ON states. The Fermi level is marked by the gray dashed lines. The small arrows represent the ferroelectric polarization vector. The large solid (gray) and open (red) arrows indicate the magnitude of tunneling current. b J–V curves in the small range of voltage for two opposite polarization orientation (blue, down, orange, up). Solid lines show fitting of experimental data using direct tunneling mechanism based on the WKB theory. The inset in (b) illustrates the write and read voltage sequences for J–V measurements
