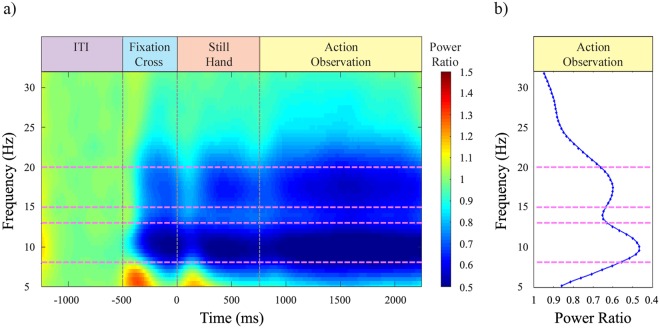
Figure 3.
Grand-averaged power ratio, averaged across all experimental conditions and right and left central clusters of electrodes. (a) Time-frequency panel of grand-averaged absolute power ratio for the whole epoch. The onset of the video clip is at 0 ms. (b) Averaged absolute power ratio for each frequency during action observation period. Pink dashed lines indicate the analysed alpha (8–13 Hz) and beta (15–20 Hz) frequency ranges, around frequency peaks of maximum desynchronization during action observation period at 10 and 17.5 Hz.

