Figure 5.
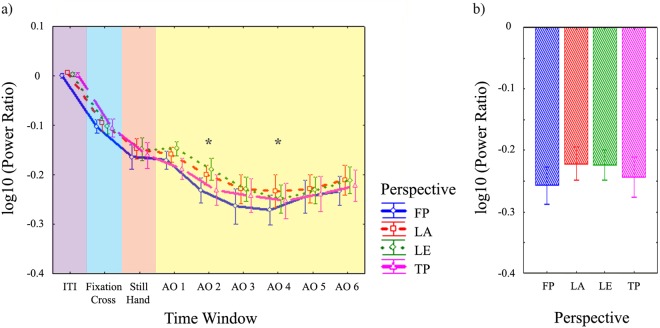
Results of EEG statistical analyses on power ratio data in beta (15–20 Hz) frequency range from central clusters of electrodes. (a) Time course of beta (15–20 Hz) log10 power ratio for each perspective, averaged across right and left central clusters of electrodes and left and right observed moving hands. The figure represents the significant Perspective × Time Window interaction of the 4 (Perspective) × 9 (Time Window) repeated-measures ANOVA performed on central beta log10 power ratio. Each time window within the epoch (ITI, Fixation Cross, Still Hand presentation periods, six Action Observation time windows of 250 ms each) is labelled by different colours. Action observation time windows with both 1) significantly stronger desynchronization for all perspectives with respect to ITI, Fixation Cross and Still Hand presentation periods; and 2) significant differences among perspectives, are indicated by asterisks. (b) Log10 power ratio of central beta frequency range for each perspective, averaged during action observation time windows 2, 3, 4. The figure represents the significant main effect of Perspective in the 4 (Perspective) × 2 (Observed Hand) × 2 (Hemisphere) repeated-measures ANOVA performed on central log10 power ratio in the beta range. All conventions as in Fig. 4.

