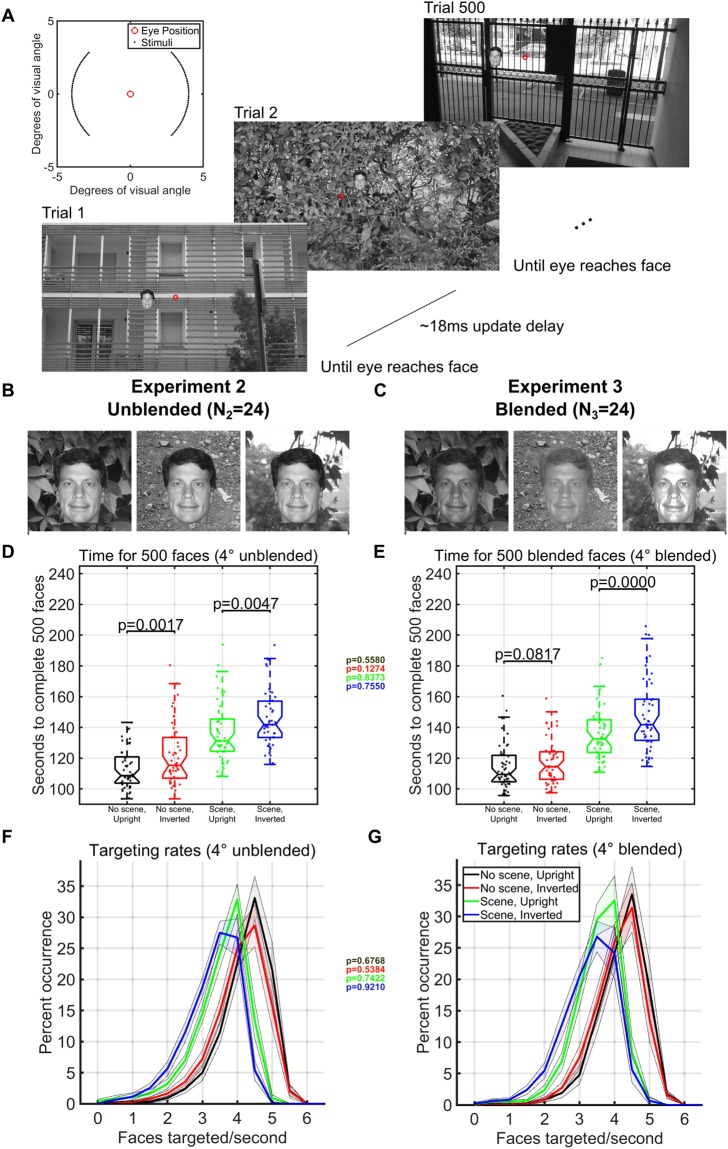
Figure 3.
Paradigm and timing results in limited eccentricities and polar angles (Experiments 2 and 3). (A) One block of 500 trials in the gaze-contingent continuous face detection paradigm with upright faces pasted on a background. The red circle represents the hypothetical gaze location and did not appear during the experiment. The subject had to localize the face with their gaze to move on to the next trial. Locations of the 3° faces were within 4° eccentricity of the location of the face in the previous trial and appeared at polar angles between 0°–45°, 135°–235°, 315°–360° (see inset at upper left). Faces shown are for illustration, but all experiments used different faces in each trial of each block. (B) Examples of how unblended faces would appear on different backgrounds in Experiment 2 (N2 = 24 subjects). (C) Examples of how blended faces would appear on different backgrounds in Experiment 3 (N3 = 24 subjects). (D,E) Boxplots of the number of seconds required, including blinks and all eye-movement times, to complete 500 3° faces at 4° eccentricities in each condition over 24 subjects in Experiment 2 (D) and Experiment 3 (E). Individual dots are the time taken to complete a single counterbalanced block of 500 faces in each particular condition for each subject. Text inset of colored p-values shows the statistical comparisons for each color-coded condition between the mean single session completion time for Experiment 2 (unblended) and the mean single session completion time for Experiment 3 (blended) using only the 17 subjects that only did one experiment (separate Wilcoxon ranksum tests for each condition). (F,G) Probability of achieving a given rate of face detection speed (including all successes and mistakes) according to each condition calculated over all possible sequences of 6 faces for each of the 24 subjects in each experiment (left histogram plot for unblended faces, N2 = 24, right histogram plot for blended faces, N3 = 24). Text inset of colored p-values shows the statistical comparisons for each color-coded condition between mean face targeting rates for Experiment 2 (unblended) and mean face targeting rates for Experiment 3 (blended) using only the 17 subjects that only did one experiment (separate Wilcoxon ranksum tests for each condition).

