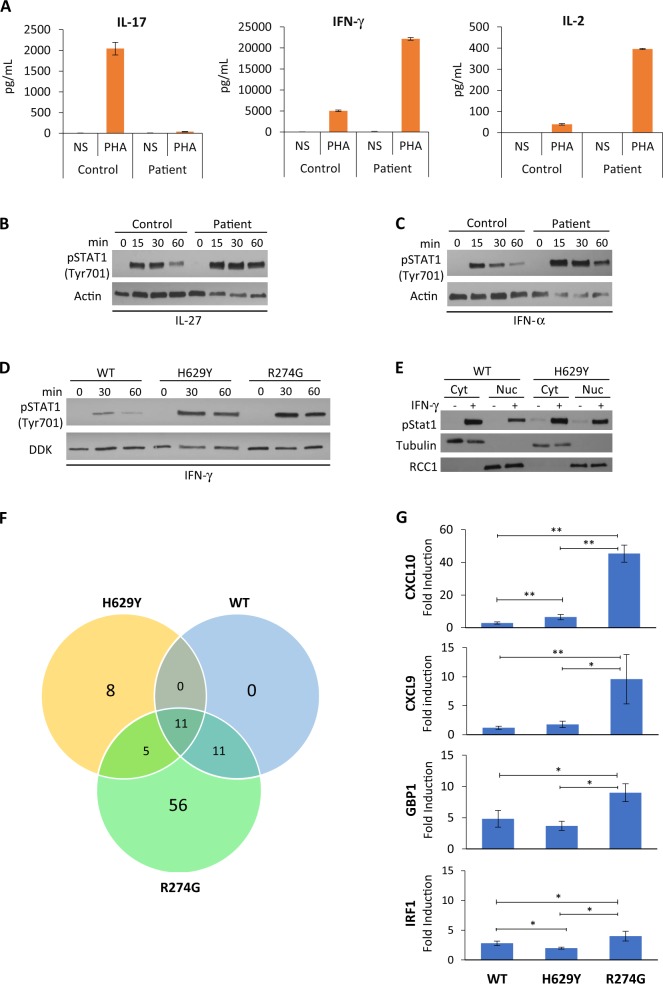
Fig. 2.
Abnormal STAT1 function and gene expression. a IL-17 (left panel), IFN-γ (middle panel) and IL-2 (right panel) secretion by PBMCs following phytohemagglutinin (PHA) stimulation for 48 h. Levels of indicated cytokines were determined by ELISA in triplicate samples. NS not stimulated. Western blot of activating STAT1 phosphorylation (anti-pTyr701) following stimulation with b IL-27 (10 µg/µL) and c IFN-α (8.5 ng/μL) in patient and control T-cell lysates. Anti-actin was used as a loading control. d STAT1 phosphorylation in STAT1 wild-type (WT), H629Y- and R274G-transfected U3A cells, following stimulation with IFN-γ (100 ng/mL). e Increase in phosphorylated STAT1 in the nuclear fraction of transfected U3A cells following IFN-γ stimulation. Anti-tubulin was used as the cytoplasmic marker and anti-RCC1 as the nuclear marker. Cyt cytoplasmic, Nuc nuclear. f Venn diagram of 1.5-fold change in IFN-γ-inducible genes. Diagram shows microarray analysis of upregulated genes following IFN-γ stimulation (100 ng/mL for 8 h) in U3A cells transfected with WT, H629Y or R274G STAT1. g U3A cells transfected as indicated with WT, H629Y or R274G STAT1 were stimulated for 8 h with IFN-γ (100 ng/mL) and mRNA levels of CXCL10, CXCL9, GBP1 and IRF1 were determined by q-PCR. Expression data, normalised to the levels of the house-keeping gene GAPDH, are presented as means and standard deviations from a total of 3–6 experiments. *P < 0.05 versus WT or R274G; **P < 0.01 versus WT or R274G (Student’s t-test)

