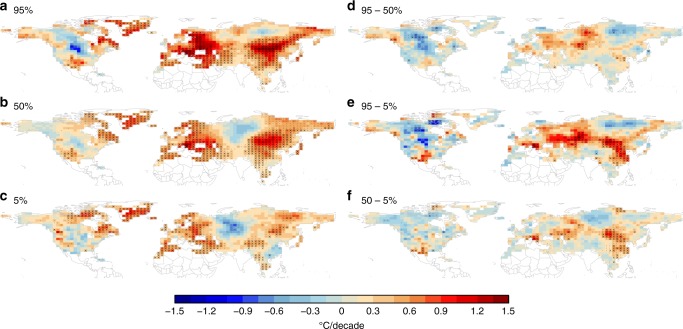
Fig. 1.
Summer trends in surface temperature over 1980–2011. a 95th, b 50th, and c 5th quantile of the HadGHCND133 gridded daily dataset; differences in the trends of different quantiles, plotted in d–f, reflect changes in the width of the distribution. Over most mid-latitude regions, especially over Eurasia, the width of the distribution has broadened and thus variability has increased. (Figure created using R statistical software)

