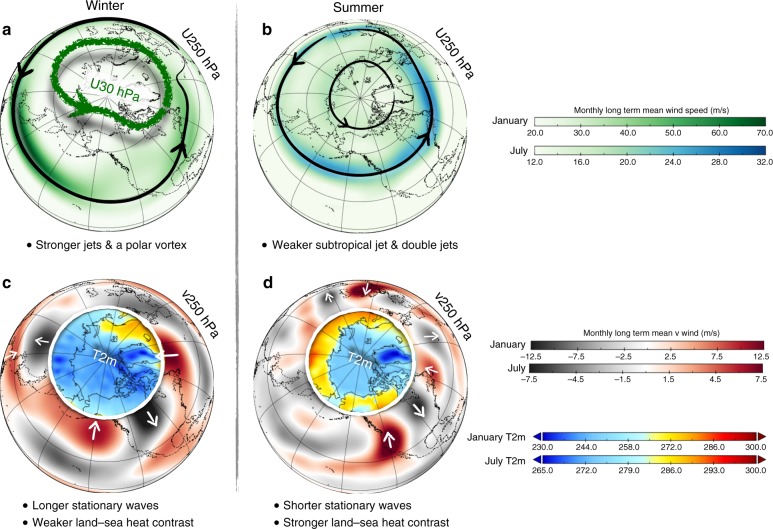
Fig. 2.
Schematic figure illustrating the main seasonal differences in upper tropospheric circulation between winter (January) and summer (July). Panels a and b show 250-hPa wind speed (green-to-blue shading) illustrating the jet streams with black arrow lines that follow the zone of maximum wind speed. The wintertime stratospheric polar vortex is outlined with the thick green line following the 30-hPa maximum wind speed. Panels c and d show the 250 hPa meridional wind speed (dark gray-to-dark red shading) depicting the stationary wave features associated with the jet streams. White arrows are added to illustrate wind direction. Basic differences in the summer circulation features, as compared to winter, include shorter stationary waves, more northerly subtropical jet, absence of stratospheric polar vortex and an Arctic front jet forming double jets. Data are 1970–2000 climatology of NCEP Reanalysis134 (downloadable: https://www.esrl.noaa.gov/psd/data/gridded/data.ncep.reanalysis.html). (Figure created using Panoply and Apple’s Keynote software)

