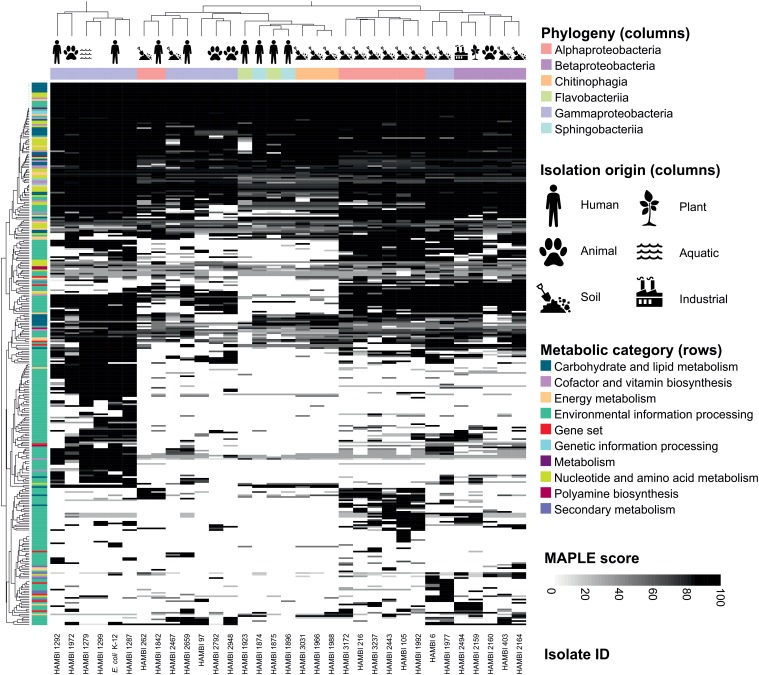
FIGURE 4.
Metabolic pathways of model community strains. The pathways were predicted from genome sequences using MAPLE. Pathway completeness (MAPLE score) is depicted as shades of gray in a heat map organized by the phylogenetic class and isolation origin of model community strains (columns) and by the presence of metabolic pathways predicted by MAPLE (rows). The metabolic characteristics display hierarchical clustering by the phylogenetic class and isolation origin of the isolates.

