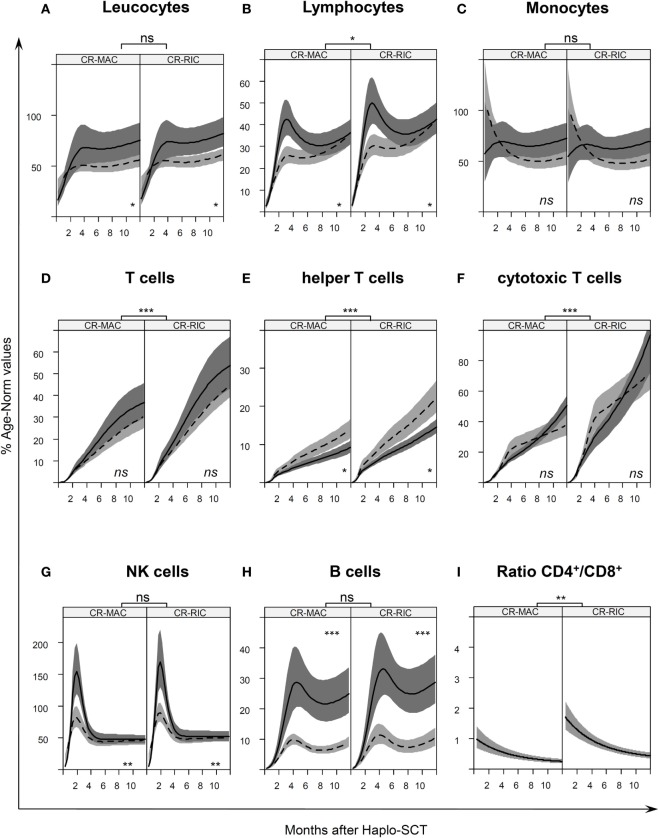
Figure 2.
Age-normalized immune reconstitution (IR) in the first year after haplo-stem cell transplantation (SCT) IR normalized by age-specific norm values (27) Table S1 in Supplementary Material, of (A) leukocytes, (B) lymphocytes, (C) monocytes, (D) T cells, (E) helper T cells, (F) cytotoxic T cells, (G) natural killer, and (H) B cells in the first year after transplantation. The curves illustrate the splines of the longitudinal trajectory of IR after SCT based on our joint models with point wise 95% confidence regions. The CR-MAC and CR-RIC panels (left and right panel, respectively) exhibit the predicted IR for patients in any remission prior to SCT according to the type of graft PBSCCD34sel (solid line with dark gray confidence regions) or PBSCCD3/CD19dep (dashed line with light gray confidence regions). (I) CD4/CD8 ratio of the absolute cell count of CD4+ helper T cells and CD8+ cytotoxic T cells at different time points after SCT. See also Figure S1 in Supplementary Material for a representation of absolute numbers for predicted values for a 10-year-old child. ns, not significant; *P < 0.05; **P < 0.01; ***P < 0.001.

