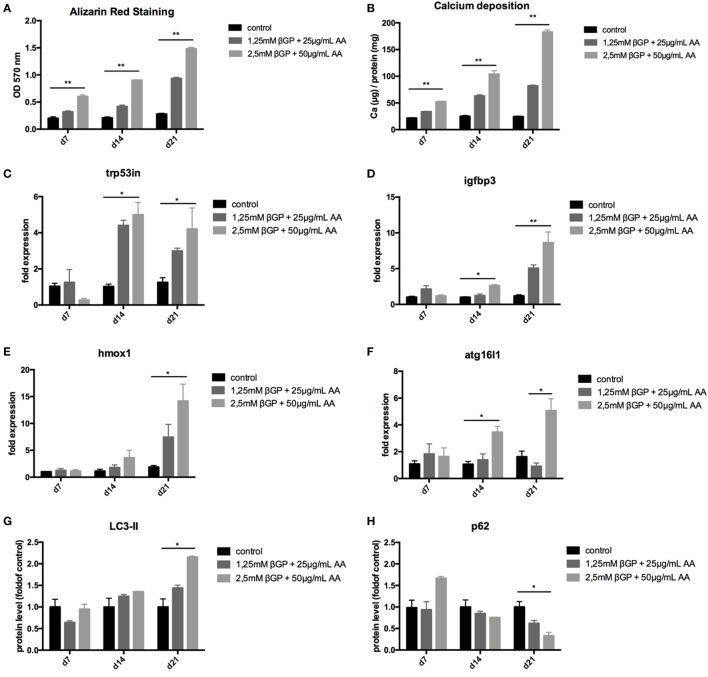
Figure 2.
Calcification induces autophagy in MOVAS. MOVAS were cultured in the absence (black bars) or the presence (gray bars) of two different calcifying conditions for 7, 14, or 21 days (n = 4 per time point and group). (A) Calcium deposition in cells was analyzed by Alizarin staining and photometric quantification. (B) The cellular calcium content was evaluated quantitatively. (C–F) qPCR analysis for respective autophagy-associated genes was performed. Western Blot analysis for detection of (G) light chain 3 (LC3) and (H) p62 levels was performed. Three independent experiments were performed. (I) A representative western blot is shown. (J,K) After 21 days of culture, the autophagic flux was evaluated in MOVAS after short-term bafilomycin treatment (n = 3). (K) A representative LC3 Western blot is shown. All data are presented as mean ± SEM. *p < 0.05, **p < 0.01.


