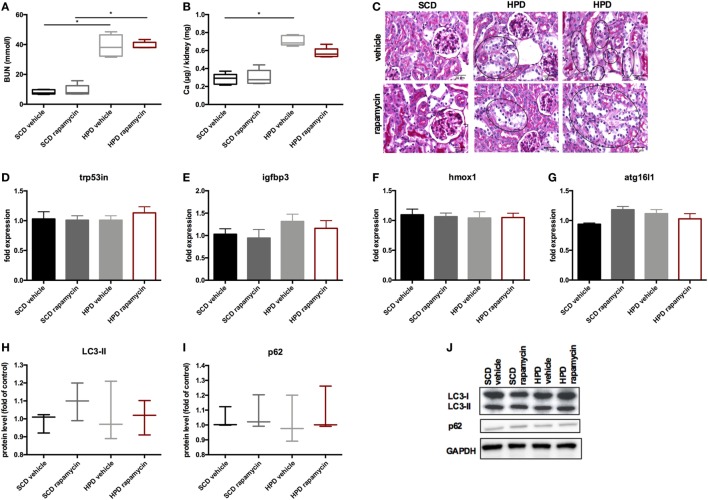
Figure 6.
Rapamycin does not influence the renal phenotype. DBA/2 mice were fed with high-phosphate diet (HPD) or standard chow diet (SCD) for 12 days and were additionally treated with rapamycin or vehicle starting from day −3 (SCD + vehicle: black bar, SCD + Rapa: gray bar; HPD + vehicle: light gray bar; HPD + Rapa: red bar). (A) Serum-blood urea nitrogen (BUN) levels and (B) calcium content of the kidneys was evaluated in mice 12 days after starting HPD (n = 5). (C) Representative pictures of periodic acid Schiff’s stained kidney sections are provided. Areas of early necrotic tubular epithelial cells are marked by black circles. (D–G) qPCR analysis (n = 5 per group) for expression of respective autophagy-associated genes was performed from kidney tissue. (H) Light chain 3 (LC3) and (I) p62 levels were evaluated by Western Blot analysis (n = 3). A representative Western blot is shown (J).

