
FIGURE 5.
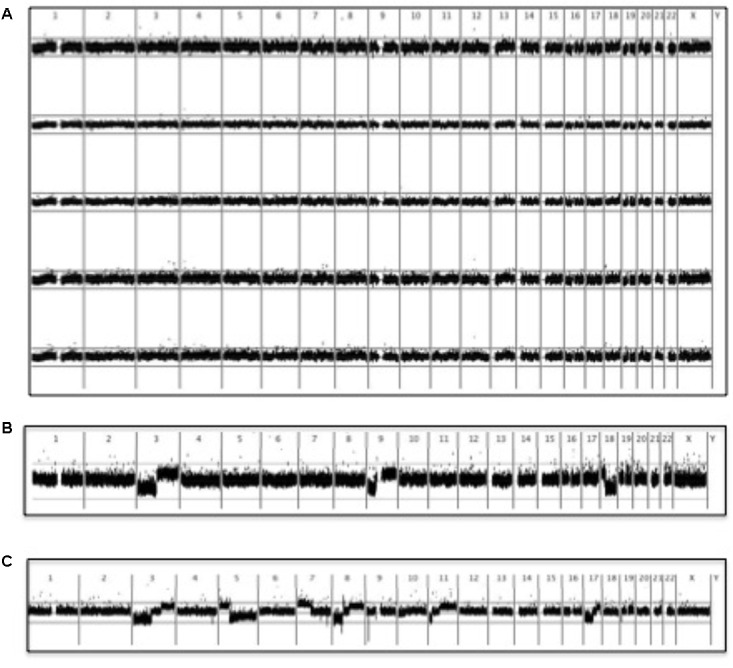
SNP microarray analysis of vemurafenib-associated cSCC. BRAFi-SCC did not display the gross chromosomal aberrations typically observed in sporadic cSCC (Purdie et al., 2009). A running average of 2 consecutive tumor: non-tumor signal value ratios is plotted on a log2 scale according to chromosomal position. Upper line represents log2(2) and lower represents log2(0.5). (A) Copy number profiles of 5 vemurafenib-associated cSCC (B) Comparison with copy number profile from a sporadic cSCC showing 3p and 9p loss: these changes were characteristic of well-differentiated cSCC (Purdie et al., 2009). Although chromosome 18 loss is also seen in this particular tumor, chromosome 18 aberrations were not as common as 3p and 9p changes in other sporadic well-differentiated cSCC (Purdie et al., 2009). (C) More extensive allelic imbalance in a sporadic moderately-differentiated cSCC (Purdie et al., 2009).