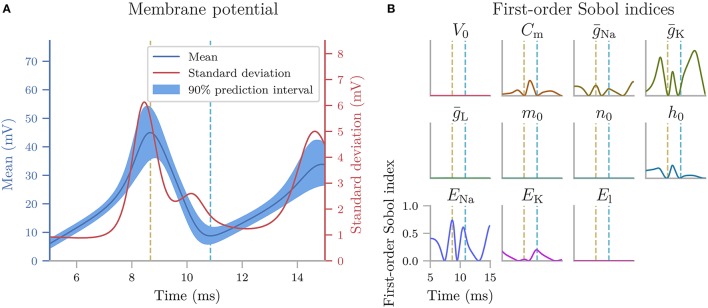
Figure 4.
The uncertainty quantification and sensitivity analysis of the Hodgkin-Huxley model, parameterized so it has a resting potential of 0 mV. The model was exposed to a continuous external stimulus of 140 μA/cm2 starting at t = 0, and we examined the membrane potential in the time window between t = 5 and 15 ms. (A) Mean, standard deviation and 90% prediction interval for the membrane potential of the Hodgkin-Huxley model. (B) First-order Sobol indices of the uncertain parameters in the Hodgkin-Huxley model. The yellow line indicates the peak of the first action potential, while the cyan line indicates the minimum after the first action potential.

