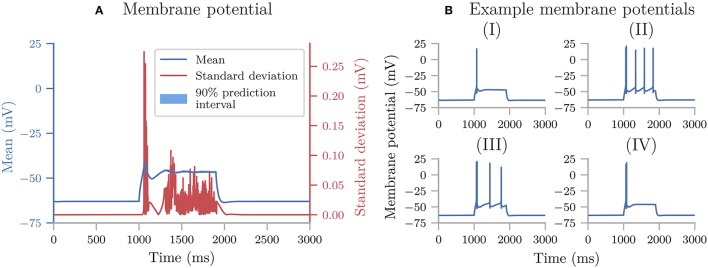
Figure 5.
Uncertainty quantification of the interneuron model. (A) The mean, standard deviation, and 90% prediction interval for the membrane potential of the interneuron model. (B) Four selected model outputs for different sets of parameters. The interneuron received a somatic current injection between 1, 000 ms < t < 1, 900 ms, with a stimulus strength of 55 pA.

