FIGURE 2.

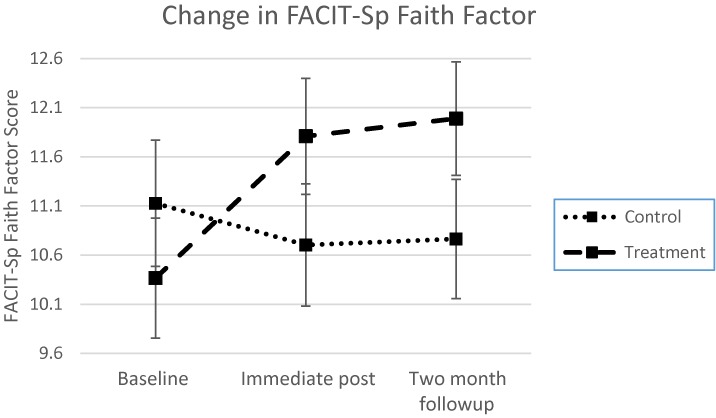
Treatment effects across time for the FACIT-Sp Faith factor. Group × time interaction is significant at p < 0.001. Error bars represent the standard error of the mean at each time point.

Treatment effects across time for the FACIT-Sp Faith factor. Group × time interaction is significant at p < 0.001. Error bars represent the standard error of the mean at each time point.