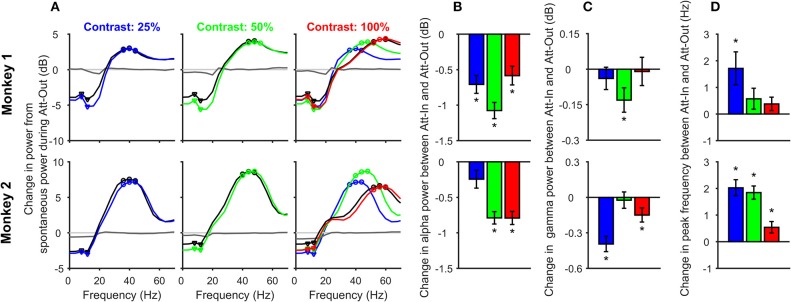
Figure 2.
Change in alpha and gamma power and gamma peak frequency with contrast and attention. (A) Change in Power-spectral densities (PSDs) during stimulus period (150–400 ms after stimulus onset) from the pre-stimulus baseline (−300 to −50 ms) for different contrasts: 25% (left panel), 50% (middle), and 100% (right), for attend-in (colored) and attend-out (black) conditions, for 63 electrodes in Monkey 1 (top row) and 89 electrodes in Monkey 2 (bottom row). All changes were computed with respect to the baseline PSD during the attend-out condition. Also shown is the change in baseline PSD for attend-in condition (dark gray trace); the same for the attend-out case is trivially zero (light gray). PSD traces for 25 and 50% contrast for attend-in condition is overlaid (dashed-dot color traces) on the 100% contrast panel to show how gamma peak frequency changes with contrast. The alpha and gamma band frequencies used for subsequent analysis are shown in triangles and circles respectively. (B) Change in alpha power (in decibels) between attend-in and attend-out condition for 25% (blue), 50% (green), and 100% (red) contrasts. Error bars represent standard error of mean across 63 electrodes from Monkey 1 (top row) and 89 electrodes from Monkey 2 (bottom row). Significant differences (p < 0.05, t-test) are indicated by “*”. (C) Same as (B), but for gamma power. (D) Change in gamma peak frequency (Hz) between attend-in and attend-out condition for contrasts 25% (blue), 50% (green), and 100% (red). Error bars represent standard error of mean across 63 electrodes from Monkey 1 (top row) and 89 electrodes from Monkey 2 (bottom row).

