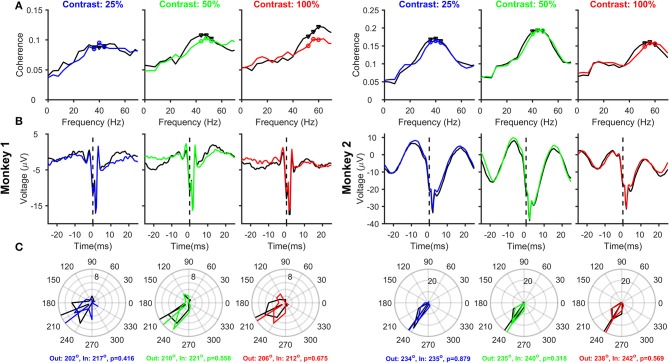
Figure 3.
Relationship between Spikes and LFPs recorded from the same electrode, as a function of Contrast and Attention. (A) Mean spike-LFP coherence for 25, 50, and 100% contrasts for Monkey 1 (three columns on the left) and Monkey 2 (three columns on the right). Black and colored traces represent attend-out and attend-in conditions respectively. Spike-LFP coherence was computed for the time interval between 150 and 400 ms post stimulus onset. Spikes and LFP were recorded from 23 and 39 electrodes in the two monkeys, whose receptive fields were within 0.2° of the stimulus center. (B) Average spike-triggered LFP average for the same electrode and analysis duration as (A); Time of the spike (0 ms) is shown by a dotted line for clarity. (C) Phase histograms of the spike-LFP coherence values at peak and two surrounding gamma frequencies, for attend-out condition (indicated by black triangles in each panel in (A) and attend-in condition (indicated by colored circles in each panel in (A). The circular means of the spike-gamma phase values are indicated for attend-out and attend-in condition, along with the p-value obtained from Watson-Williams test to compare the mean phases.

