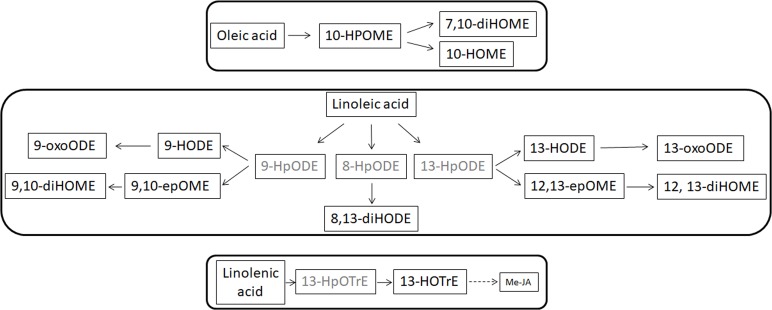
FIGURE 5.
Suggested overview of oxylipin pathway in XfCFBP8402. Black font represents oxylipins that were found in the samples and gray font represents oxylipins that were expected in the samples but not found. Continuous lines represent single step in production of the oxylipins, whereas dotted lines indicate the presence of multiple steps to achieve the compounds indicated in figure.

