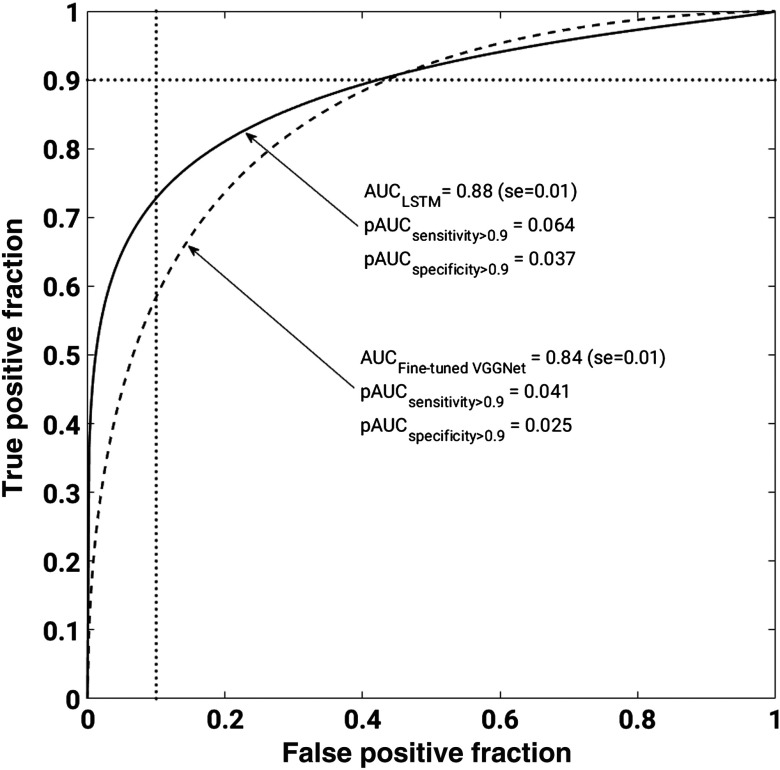
Fig. 5.
ROC curves corresponding to fine-tuned VGGNet and LSTM model performances in discriminating benign and malignant lesions. Solid line represents LSTM model and dashed line represents fine-tuned VGGNet. LSTM significantly outperformed the fine-tuned VGGNet, resulting in and , with , in the task of distinguishing benign and malignant lesions. We note that ROC curves cross. To better understand methods’ performances, we calculate partial AUC values for specificity (1 – false positive fraction) range from 0.9 to 1 and sensitivity (true positive fraction) range from 0.9 to 1. The vertical and horizontal dotted lines correspond specificity = 0.9 and sensitivity = 0.9, respectively.

