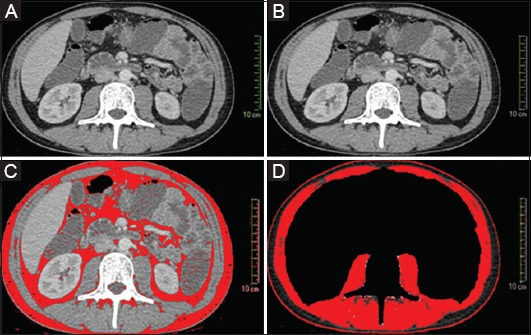
Figure 1.

Abdominal body composition analysis using NIH ImageJ. (A) The original CT image; (B) the scale is set at a known distance (10 cm) from the original image; (C) definition of the total body fat area, applying the thresholds (-190 to -30 HU); (D) definition of skeletal muscle area, after cropping the abdominal contents and L3 vertebra and applying the thresholds (-29 to+150 HU)
