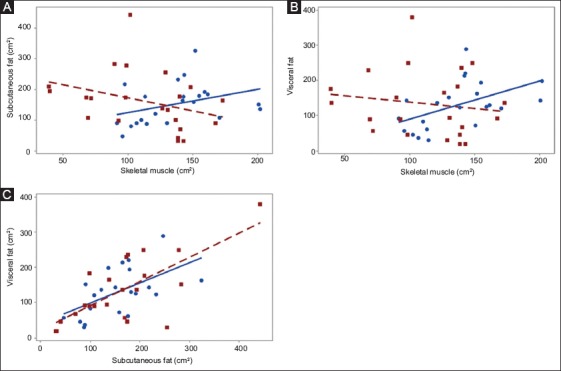
Figure 2.

Correlations among abdominal body characteristics in people with inflammatory bowel disease (IBD: brown squares) and controls (blue circles). (A) Subcutaneous fat vs. skeletal muscle: IBD: (rho: -0.43, P=0.045) vs. controls: (rho: 0.47, P=0.026). (B) Visceral fat vs. skeletal muscle: (rho: -0.13, P=0.553) vs. controls (rho: 0.51, P=0.015); (C) Subcutaneous fat vs. visceral fat; IBD: (rho: 0.61, P=0.002) vs. controls: (rho: 0.62, P=0.002)
