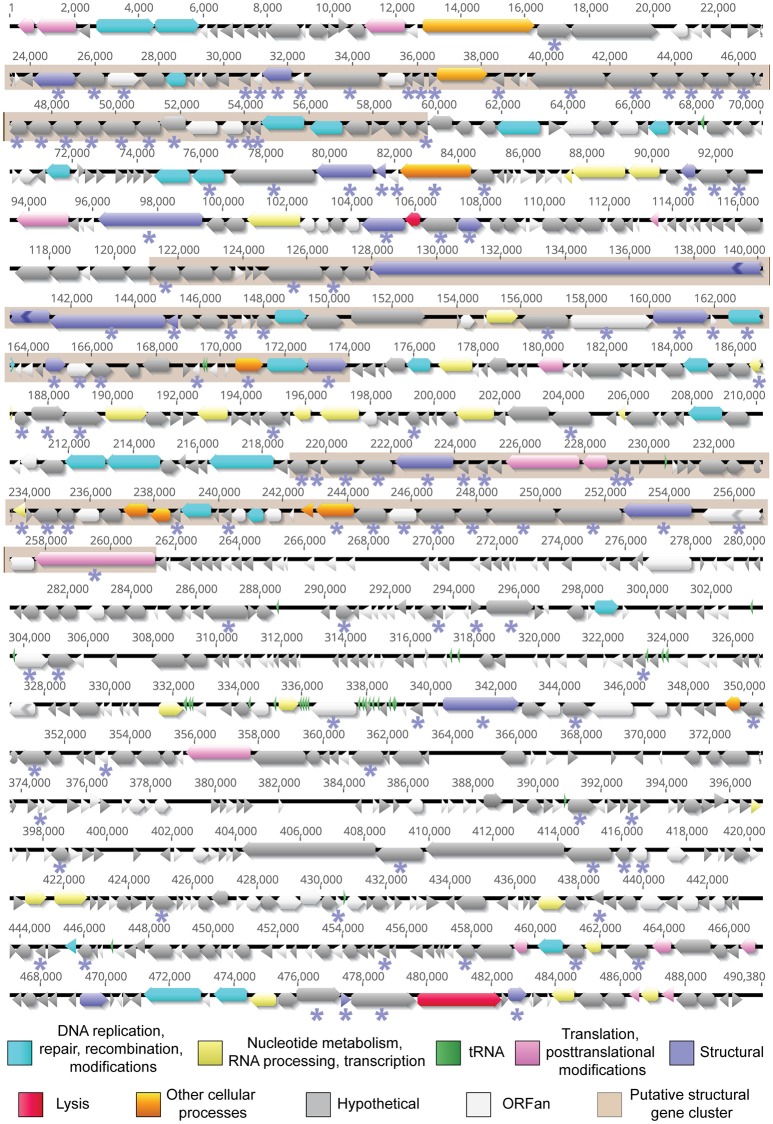
Figure 3.
The annotated genome of Atu_ph07. ORFs are represented by functional categories in corresponding colors. Regions shaded in beige represent putative structural protein clusters as identified using ESI-MS/MS analysis. Proteins detected by ESI-MS/MS analysis are indicated with an asterisk (*) below the corresponding ORF.

