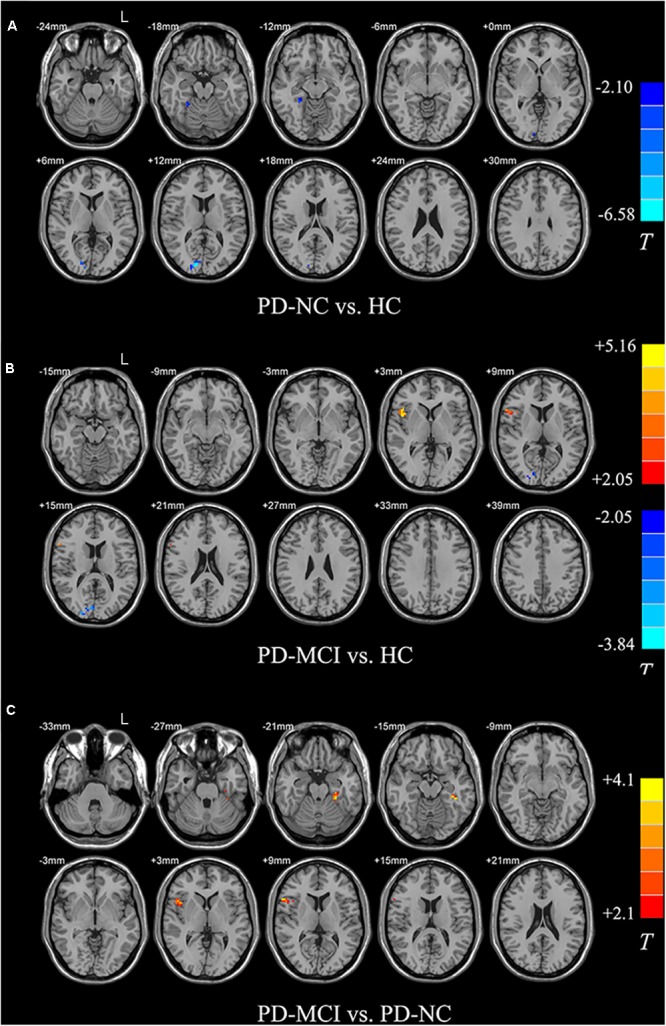
FIGURE 2.

Differences in ALFF between groups. All the multiple comparisons were performed with a small volume correction based on non-parametric permutation tests, at a cluster-level threshold of p < 0.05 (n = 10000 permutations, FWE-corrected) with a cluster-forming threshold at the voxel level p < 0.01. (A) Differences in ALFF between PD-NC and HC; (B) Differences in ALFF between PD-MCI and HC; (C) Differences in ALFF between PD-MCI and PD-NC. For details of the significant regions, see Table 2.
