Figure 3.

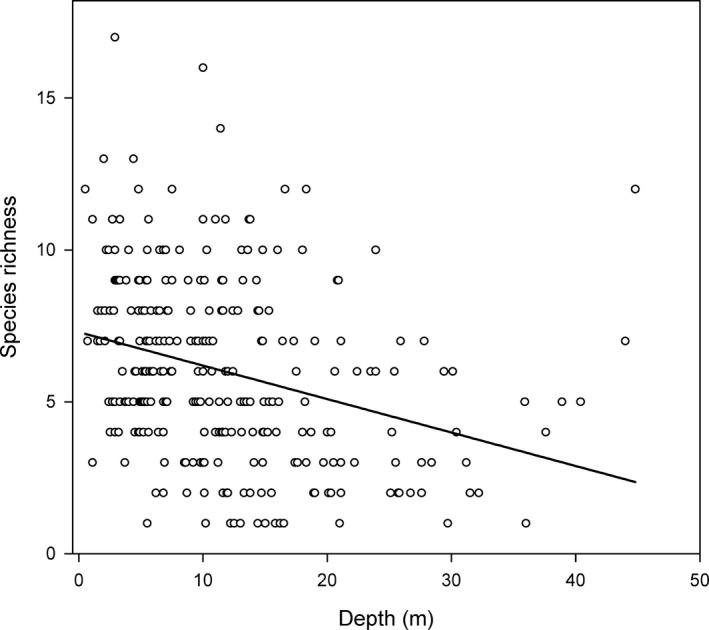
Pearson's r correlation (solid line, −0.307, P < 0.001) between species richness and depth across study sites (n = 285).

Pearson's r correlation (solid line, −0.307, P < 0.001) between species richness and depth across study sites (n = 285).