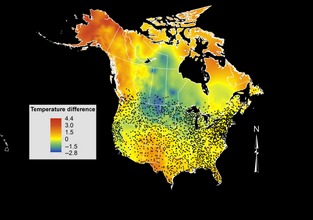
Figure 3.

Breeding season temperature difference (°C) across North America between 1984–1988 and 2002–2006, calculated as the means of observed temperatures during April, May, and June of each year within the separate time periods. Overlaid are the locations of breeding bird survey routes that were included in this study for purposes of measuring temperature differences within the ranges of each of the 34 passerine species for which northern and southern breeding range limits were included. Routes located above 52° N latitude were excluded due to low sampling density. Map is projected in Albers Equal Area to improve visual representation of the study region.
