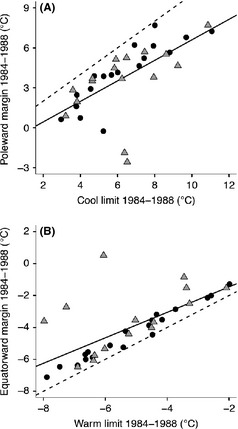
Figure 4.

Relationship between mean breeding season temperature at the (A) cool edge and (B) warm edge of the realized niches (calculated as the 10 coldest/warmest routes with species’ occurrence during 1984–1988) and mean breeding season temperature at the range margin expected to correspond to the niche edge (calculated as the 10 poleward or equatorward routes with species’ occurrence during 1984–1988). The black line represents the observed relationship, and the dashed line represents the expected relationship if there is perfect correspondence between thermal niche limits and species’ range margin. Circular data points represent species that are shifting as expected based on temperature change. Temperature was corrected for total niche breadth.
