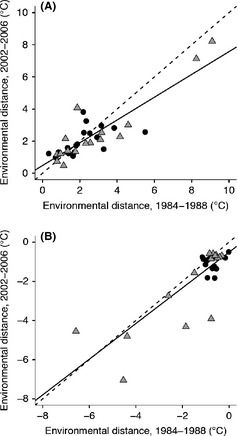
Figure 5.

Temporal relationship in environmental distance calculated as the difference in mean breeding season temperature (°C) separating the thermal niche boundary and range margin in 1984–1988 and 2002–2006 for (A) the poleward margin and cool niche boundary, and (B) the equatorward margin and warm niche boundary. Points above the 1:1 line in (A) represent species for which the temperature difference between their cold niche limits and poleward range margin became larger through time. Points below the 1:1 line in (B), conversely, represent species that had populations closer to their warm niche limits in the early time period than in the later one. The black line represents the observed relationship, and the dashed line represents the expected relationship. Triangular data points indicate species whose margin shifted equatorward, while circular data points indicate species whose margin shifted poleward.
