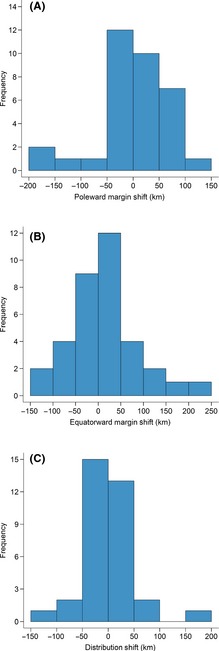
Figure 6.

Frequency distribution of rate of latitudinal range margin shift at (A) the pole‐ward margin and (B) the equatorward margin from 1984–1988 to 2002–2006. Positive values represent pole‐ward shift at the range margin, while negative values represent equatorward shift at the range margin. (C) Cumulative change in latitudinal extent of species’ range when range margin shift at poleward and equatorward margins is combined.
