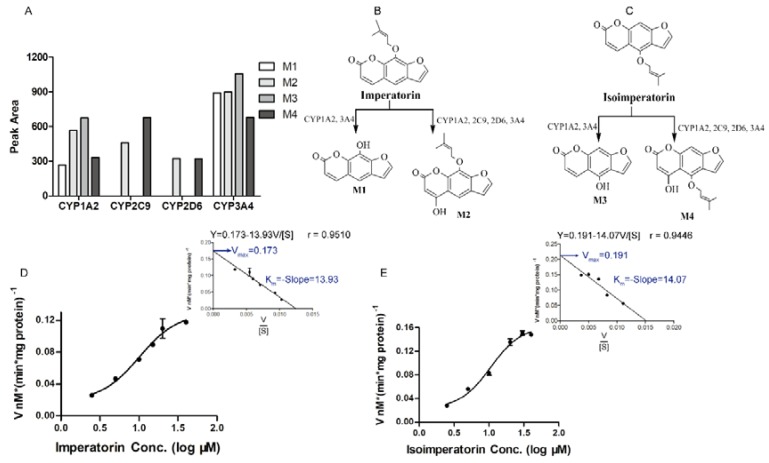
Figure 5.
Metabolic pathway and metabolic kinetic constant information of imperatorin and isoimperatorin in human liver microsomes. (A) 50 µM Imperatorin (or isoimperatorin) was incubated with recombinant CYP450s, and the relative quantity of metabolite M1, M2, M3 and M4 were determined by the peak area of extract ion chromatograms. (B,C) Summary of imperatorin and isoimperatorin metabolic pathways. (D,E) Imperatorin (or isoimperatorin) metabolites formation rate vs. its parent drug Log concentrations (in accordance with the Michaelis–Menten saturation curve) and their Km and Vmax in human liver microsomes were calculated from the Eadie–Hofstee plot (inset).

